What’s in store for the spring selling season
With spring around the corner, buyers, sellers and property professionals are gearing up for a lift in sales and listings activity – but for some sellers in Melbourne, Hobart and Sydney, spring does not necessarily mean that demand will lift.
Spring can be a popular time for both sellers and buyers alike as the chill of winter recedes and blooming gardens show properties at their best – with the added benefit of transactions settling before the holiday season.
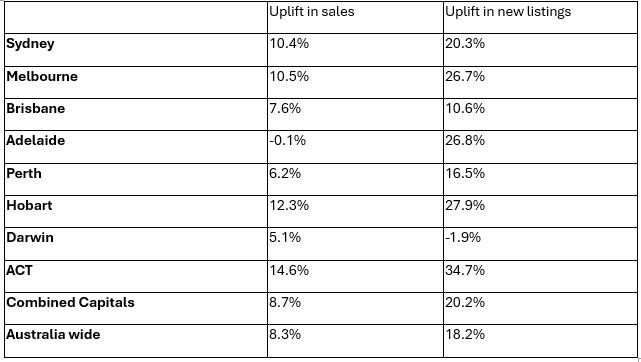
The latest CoreLogic analysis shows an average uplift of 18.2% in fresh listings and 8.3% for sales over the past decade, led by cities across the East Coast.
Figure 1 shows the past decade average uplift between winter and spring across Australian cities. Interestingly, colder regions also have the largest increase in spring time listings.
Figure 1. Past decade average, difference in sales and listings volumes between winter and spring

However, seasonal factors can still be tempered by broader market conditions like interest rates and economic conditions. Sales volumes across some cities have actually declined during spring when the market has been in a downswing, such as in Sydney and Melbourne in the spring of 2015, 2017 and 2018, when temporary macroprudential rules created a sharp decline in investor demand.
Looking at spring of 2024, it is possible we could see demand come under pressure from a continuation of high interest rates, slowing economic conditions and low consumer sentiment, and sellers may struggle in two of the state capitals in particular.
The state of the market in the lead-up to spring
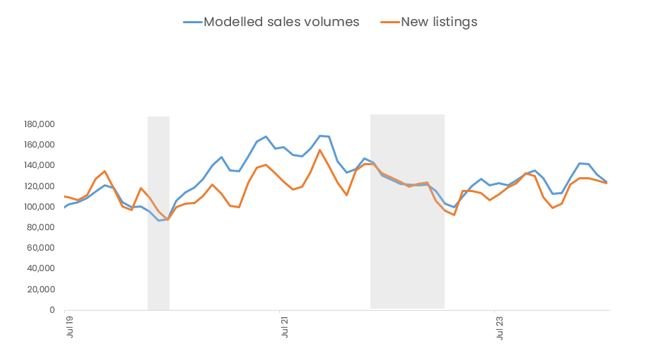
One way to assess buyer and seller conditions is to consider the number of homes sold, against the number of properties newly advertised for sale in the same period. Figure 2 shows the rolling three-month count of sales and new listings across Australia, with shaded parts of the graph representing periods of dwelling value falls. In the three months to July there was an estimated 124,500 sales against 123,000 new listings added to the market for sale. This suggests a higher level of buyers than sellers nationally, with demand outpacing supply.
Figure 2. rolling three-month count of sales and new listings - national

However, sales and new listings in the past three months were more balanced over this period than a few months ago (142,500 sales occurred in the three months to April against 128,000 new listings), and for the same period last year (123,000 sales against 112,000 new listings).
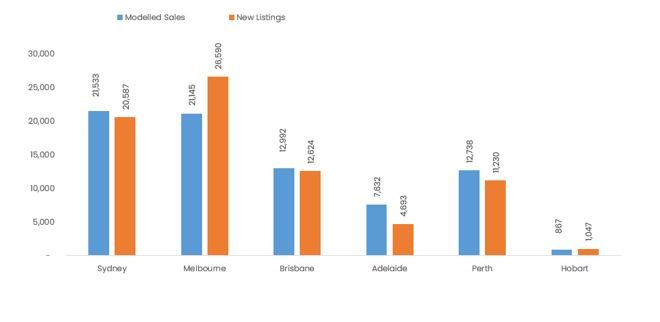
The state of supply and demand across the Australian capitals is highly varied, which will lead to equally varied outcomes this spring. Figure 3 shows the most recent count of sales to new listings. Markets with more sales than new listings are considered ‘seller’s’ markets, while markets with a higher number of new listings are generally more in favour of the buyer.
Figure 3. Modelled sales versus new listings, three months to July 2024

The biggest discrepancies between sales and new listings are currently in Melbourne, where there were 5,400 more new listings added to the market in the past three months than sales taking place, and Adelaide and Perth were on the other end of the spectrum, where sales vastly outpaced the number of new listings added.
This data suggests Perth and Adelaide sellers are heading into the spring selling season in a powerful position, with total stock on the market at very depleted levels and there has been more than one sale for each new listing added to the market in the past few months. The urgency across these markets is particularly evident in days on market, where the median selling time for Perth dwellings was just 10 days in the three months to July. In Adelaide, median days on market was higher (28), but is down from this time last year (33).
Where are stock levels particularly high or low?
Another way to assess the state of a market is by comparing total listings levels with historic averages. Total listings reflect the total amount of stock on the market, which can rise over time if there are not enough sales to absorb the flow of new listings.
For the month of July, CoreLogic analysed markets with the highest and lowest levels of total listings on the market relative to the previous five-year average for the area. Figure 4 (see attached below) shows the top 20 state capital city markets with the highest and lowest volume of stock for sale, relative to historic averages, as well as recent home value changes. The areas with relatively high stock indicate market conditions favour buyers, while sellers have the upper hand in low-stock markets.
CoreLogic analysis indicates that sellers will have an advantage this spring in Adelaide and Perth, and some of the more affordable markets of Brisbane, such as Beaudesert. But for some sellers in Melbourne, Hobart and Sydney, spring does not necessarily mean it is a good time to sell. Prospective vendors should asses the state of their local market, as they may find there is more competition for sellers in the months ahead.
The data points to a particular weakness in the Melbourne SA3 markets of Sunbury in Melbourne, and Brighton in Hobart. For the Melbourne and Hobart markets with high total listings, sellers appear to be in a fairly flat, or falling market, based on the three-month value change. The most depleted markets are in Adelaide, Perth and Brisbane, where the minimum uplift in value was 3.7% over the three months to July in the Norwood - Payneham - St Peters region of Adelaide.
The depth of housing demand may be tested as we move into spring, especially in markets like Melbourne and Hobart where listings are already elevated. A rise in new listings is anticipated, but a lift in demand may not occur at the same time. If we do see advertised stock levels rising though spring, it’s a good sign that we may see some further momentum leave the upswing in the Australian dwelling market.
http://See the highest and lowest change in stock on market across the capitals (SA3s) - July 2024
Week Ending 15 Aug
Source: CoreLogic
